indicators

Make faster decisions and better predictions

Gainsmaker is an artificial intelligence platform that tracks the flow of institutional money in the stock market. Used by mid-sized funds, family offices and sofisticated investors to make better investment decisions.

A new way to track Smart Money moves

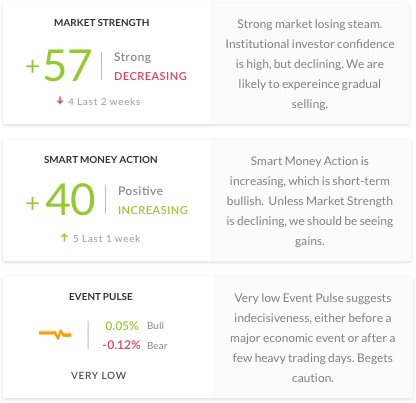
Institutional investors drive the stock market. We as investors, want to understand how large institutions are positioning themselves so we can make better profitable decisions. Gainsmaker uses machine learning to extract the collective intelligence of institutional investors and distills it into three simple indicators that forecast future market moves.

Existing methods to determine institutional sentiment – such as looking at block trades, SEC filings, or put-call ratios – have drawbacks, being either short term, myopic, lagging or possibly skewed by a few market participants.

Our approach overcomes many of these limitations and uncovers not only the confidence level of institutions and their current appetite for risk, but also what they are likely to do in the next 1-2 weeks!

Responsive image
I am a professional money manager who manages several million dollars of private and institutional clients. Gainsmaker is a GAME CHANGER, if you use it right! It gives me the confidence to stay in certain trades, knowing what the market sentiment is. That kind of information is priceless!!!
Ron R.
Ron R. Money Manager

The intelligence behind our innovative approach

The secret to Gainsmaker is our modeling of the financial markets to track the flow of smart money on a daily basis. We view the stock market as a hub-and-spoke network.
The hub-and-spoke model has revolutionized industries. It has made airlines more efficient and enables logistics services such as Fedex, UPS and Amazon to move goods faster and cheaper. In our case, we’ve applied it to track how money flows. Our network mirrors what typically happens in real-life. When institutions buy stocks, the money leaves the hub to the nodes, and when they sell, it returns to the hub. Essentially, money is always returning to the hub before it can be deployed again. By analyzing the back and forth flow of money within this hub-and-spoke network we can decipher the collective mindset of institutions and moves they are making.

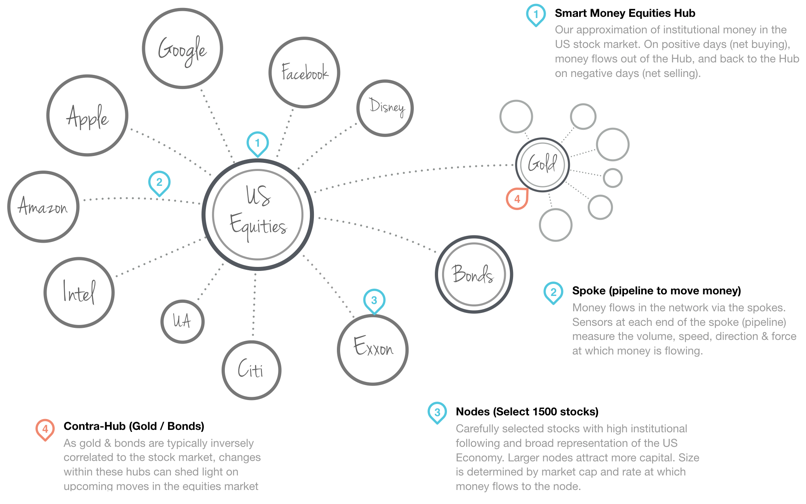
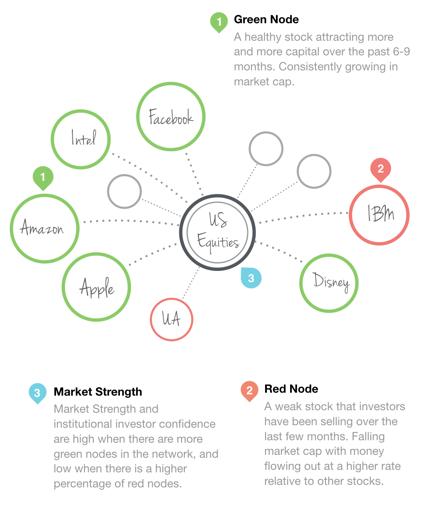
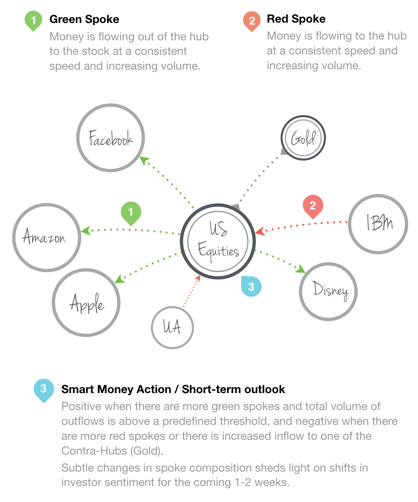
How we extract collective intent of Smart Money in the stock market.

As investors, what we want to know are essentially three things about the collective mindset of institutions -- their confidence level in the market, their short term outlook, and the impact of their actions. We have mapped these into 3 simple indicators.
Indicator #1
Market Strength
Market Strength measures the investor confidence level. How confident are they about the current investing environment and what is their appetite for risk? Higher confidence leads to gains, lower volatility and a stronger market overall; whereas lower confidence leads to selling, higher volatility and a weaker market.
Market Strength is the most important indicator, as it signifies the current risk in the market.

Indicator #2
Smart Money Action
Smart Money Action captures the short-term outlook institutions have about the stock market. How are they positioning themselves for the next 1-2 weeks? Are they being optimistic and buying, simply taking their foot off the gas, or pessimistic and selling.
As smart money tends to be the most informed, their actions are powerful leading indicators for stocks.

Indicator #3
Event Pulse
Event Pulse analyzes the collective impact (events) of buying and selling actions done by institutions. Are their actions causing unusual changes in the flow of money, i.e. is the spoke more active than usual, did the direction of money flow change within the spoke, or did the action cause some abnormal change to the node (e.g. a large increase or decrease to the market cap)?
Event Pulse is best used to confirm the current trend or signal a reversal.
See Gainsmaker in Action
2016 Elections
Brexit
Greece & China Turmoil
Housing Recovery
Housing Crisis
On Oct. 11th, Gainsmaker detected that smart money was leaving the market. Nov. 7th, high bullish activity signaled a reversal. And the day after elections, the extremely bullish Event Pulse was a leading indicator for more gains.
June 15th was the first clue that smart money was getting defensive. While the indexes rose, the SM Action kept decreasing leading up to the vote. On June 24th we were close to a market bottom and on June 28th the uptrend resumed.
This one could be seen from a mile away. In mid May, SM Action turned negative and Market Strength soon followed. Aug 17th both were near the zero line for a few days (which implies indecision and uncertainty). A week later we neared the market bottom.
Even though SM Action started increasing early April, the Market Strength was very negative (under -75). On Apr. 7th we saw the first signs of a recovery. On June 2nd, the Market Strength swung the other way signaling more gains.
Oct 18th Market Strength and SM Action both changed to decreasing while the S&P index was near its recent high. This is a bearish signal. On Dec 11th, we had a lot of bearish activity while Market Strength was negative, confirming more downside.
Erik O. Fund Manager
As a portfolio manager, I can now focus on the fundamental analysis I do best because Gainsmaker provides me with the important tactical data that any investor should consider before trading a position. Its proprietary technique, I have found extremely helpful in framing investment decisions, especially around timing.

An early warning system for your portfolio

Our predictive analytics engine forecasts stock price movements, enabling you to validate your decisions, pressure test your assumptions and know when danger lies ahead.
A word of caution: our alerts are more accurate for stocks with higher institutional sponsorship such as mid and large caps. Our accuracy is lower for certain small cap stocks, ETFs and IPOs .

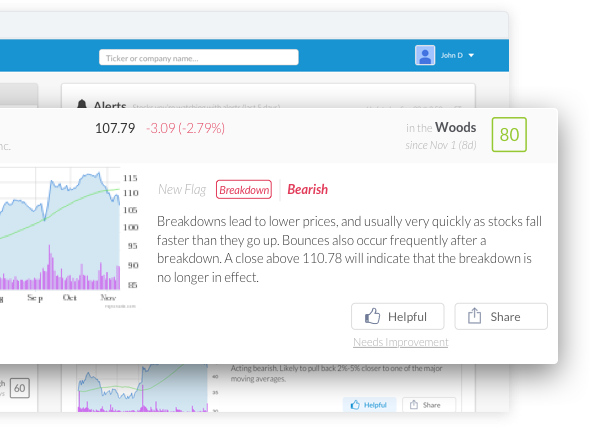
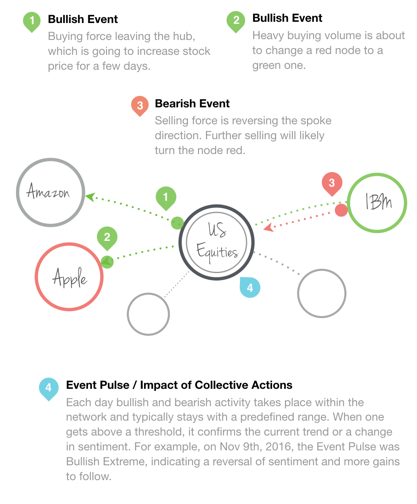
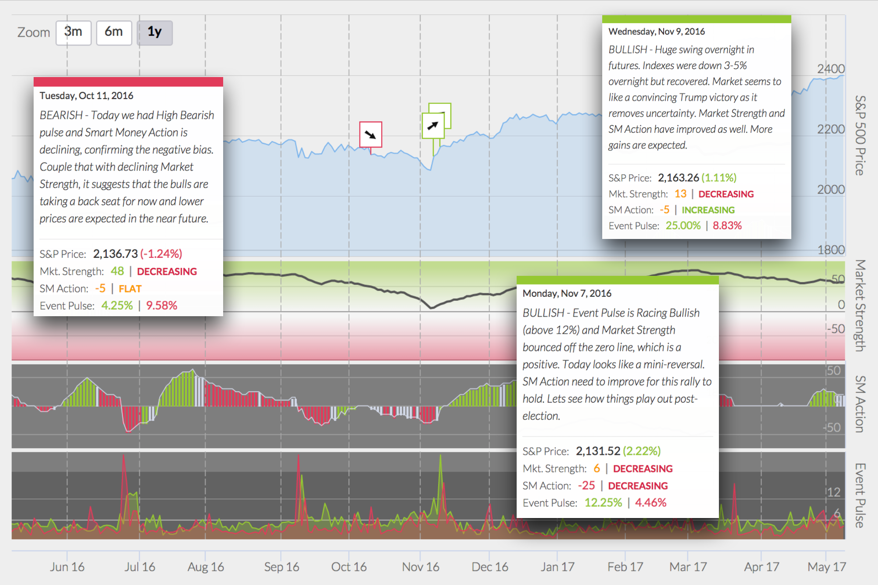
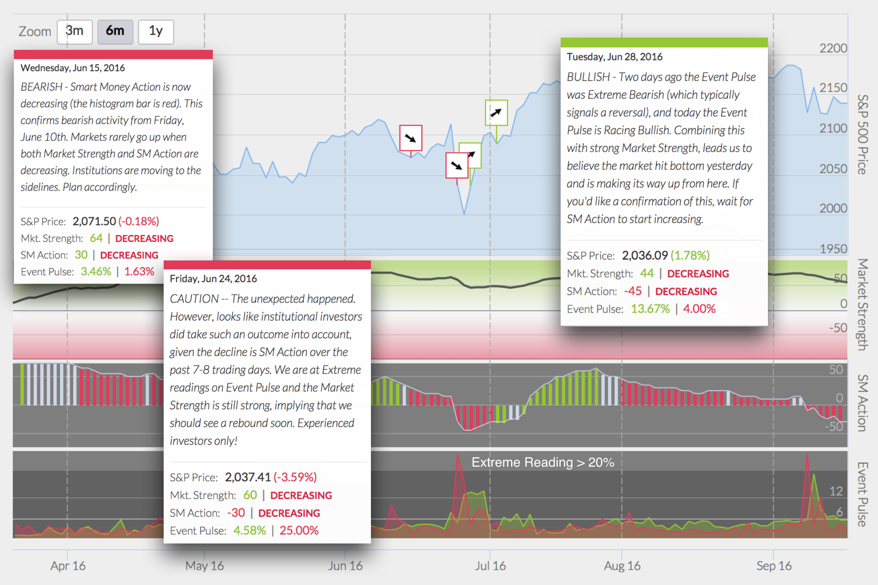
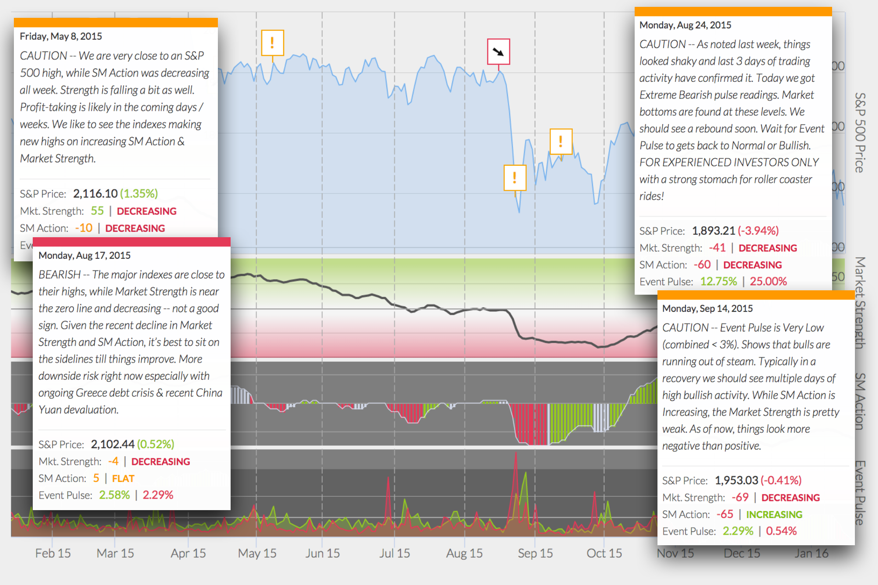
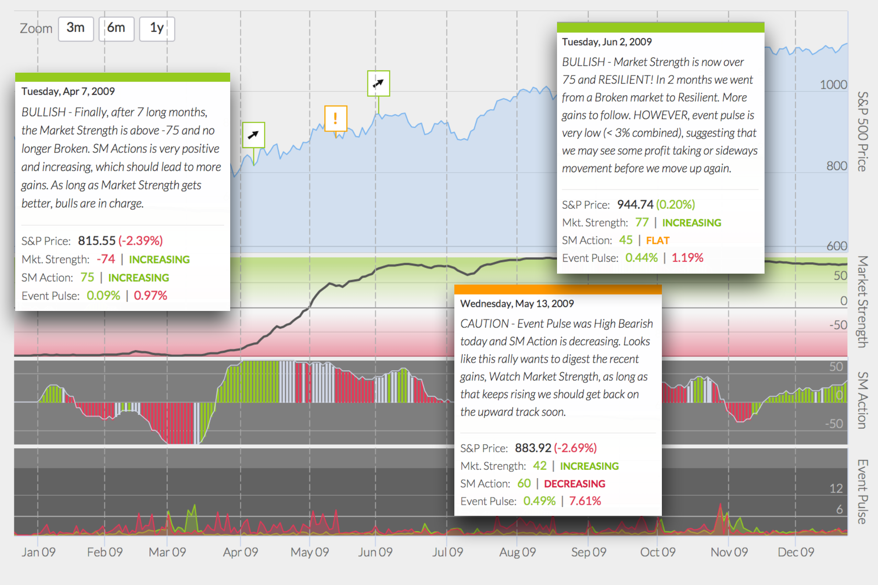
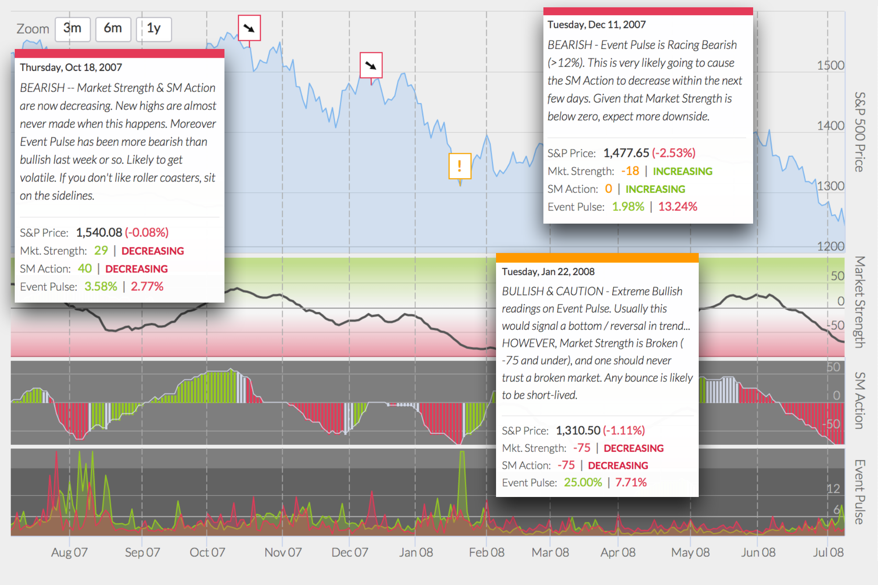
At the end of each trading day, Gainsmaker scans the institutional activity and events to identify inflection points or areas where stock prices are more likely to change or reverse. We generate alerts notifying you on price levels to watch or if the action is bullish or bearish.

Our predictive algorithms self-adjust to changing market conditions and capture both fundamental and technical influences on the market. Given that traders and institutions pay attention to technical levels, we pick up changes in money flow around those technical levels. Similarly, we detect changes in money flow when institutions are making value plays or investing in stocks on fundamental data.

Rohit G. Individual Investor
Gainsmaker is like having a close friend who’s an analyst. Except this friend is always available, almost always right and you don’t feel bad bugging them! I’ve been using Gainsmaker for a few years and it has given me some fantastic opportunities and kept me from making mistakes!
For a limited time, we’re offering free access until December 2017